Symmetrical Triangle
This pattern is formed by two converging trendlines, one connecting higher lows and the other connecting lower highs, creating a triangle-like shape on the price chart. The symmetrical triangle pattern suggests a state of balance between buying and selling pressure, indicating indecision in the market.
Basic chart
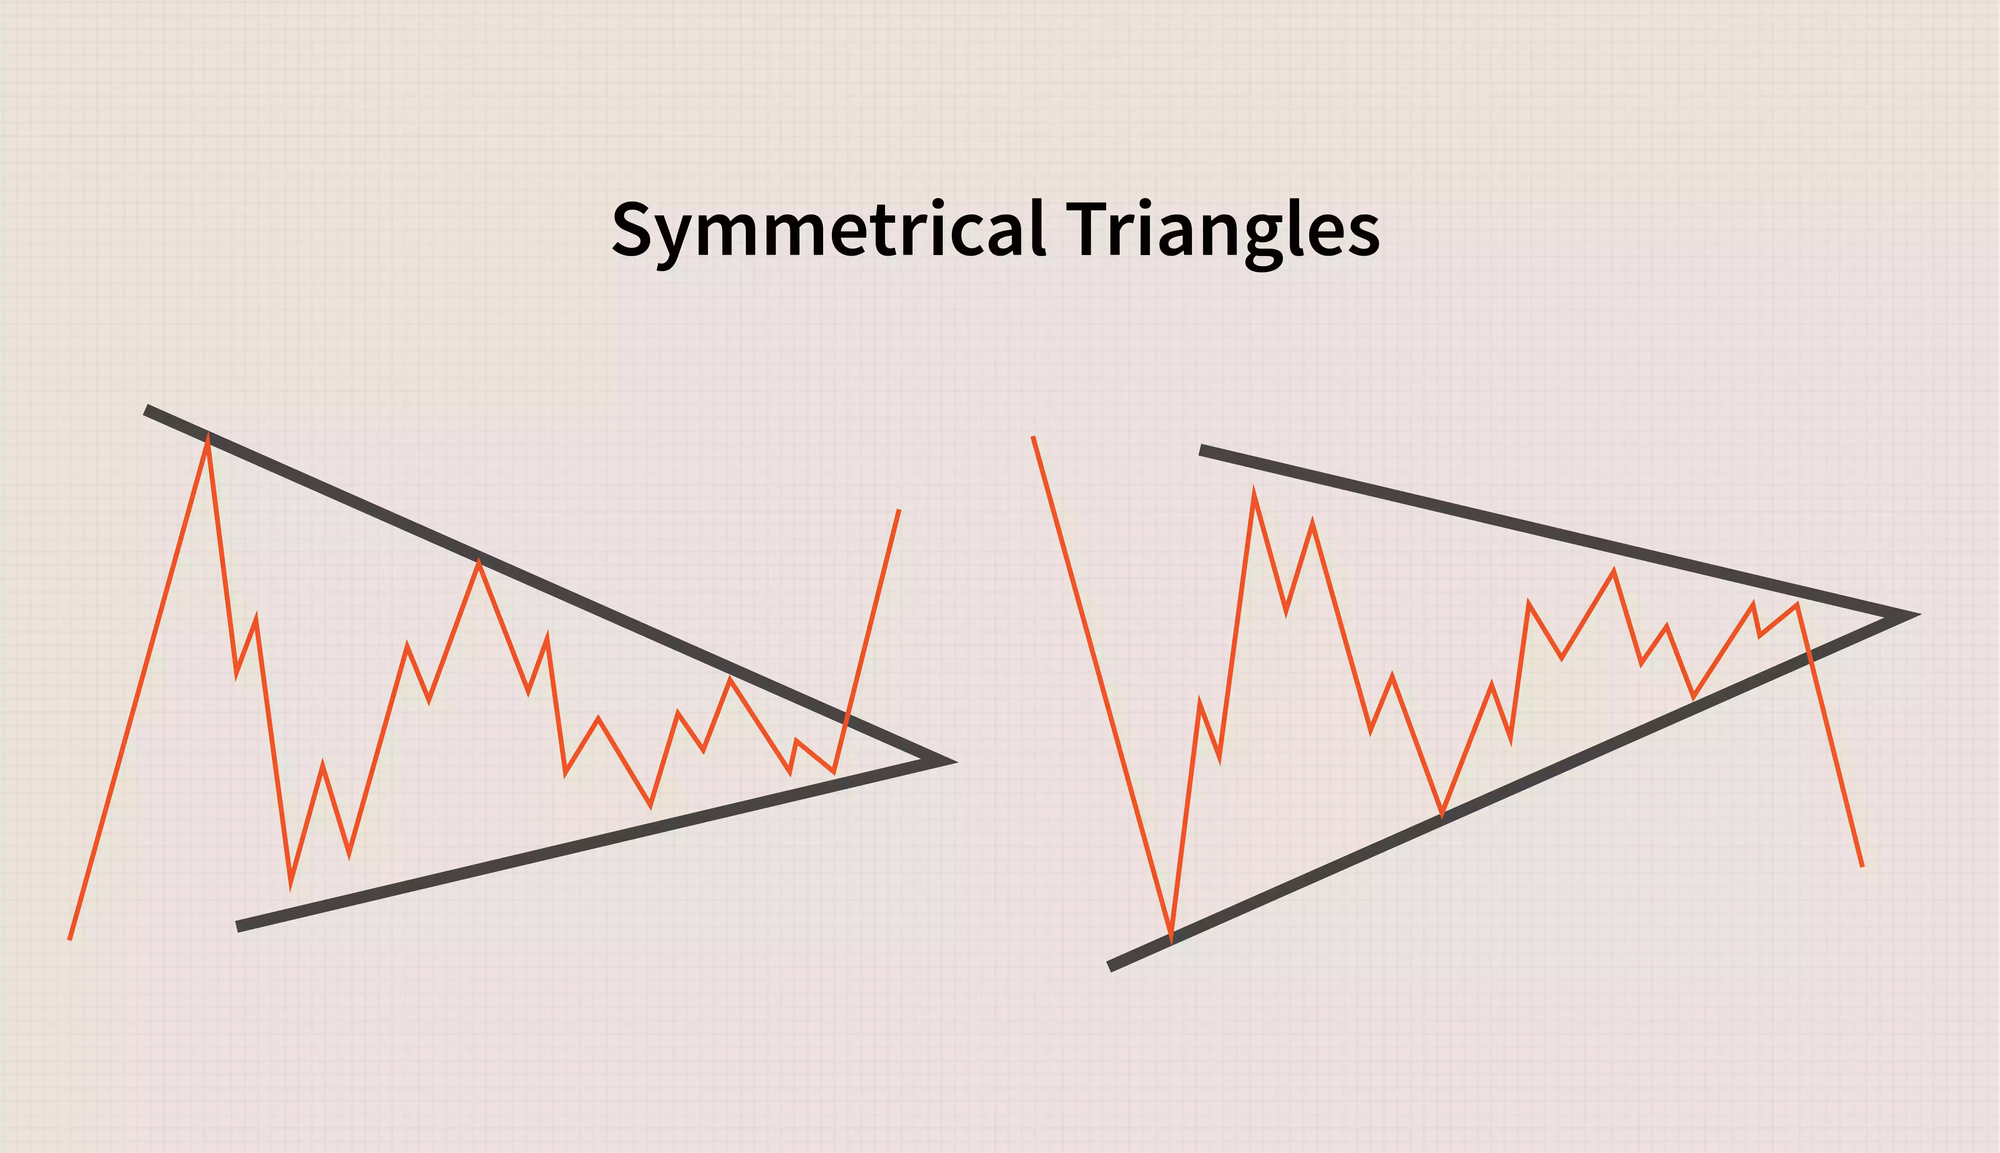
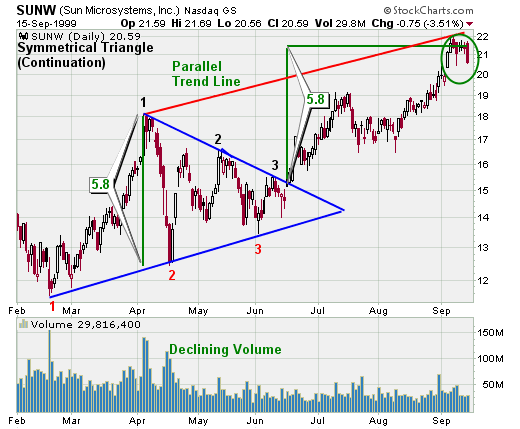
The pattern is defined by two trendlines, one ascending (connecting higher lows) and one descending (connecting lower highs). As the triangle progresses, trading volume typically decreases, signaling reduced market activity and uncertainty. The distance between the high points and low points within the pattern is roughly the same, resulting in a symmetrical appearance. These trendlines meet at a point, forming the apex of the triangle.
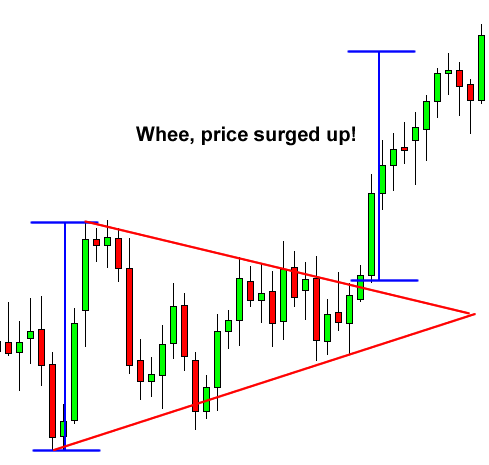
Target and stop-loss
Traders look for a potential breakout from the symmetrical triangle pattern. A breakout occurs when the price moves decisively above the upper trendline (bullish breakout) or below the lower trendline (bearish breakout). Traders usually wait for a clear and decisive close above or below the trendline to confirm the breakout before considering trades. The projected target for the breakout move is often measured by taking the height of the triangle (the vertical distance between the high and low points) and adding it to the breakout level.
Trading Considerations
It's important to note that not all symmetrical triangles result in breakouts. Some triangles may lead to a continuation of the existing trend, while others may lead to a trend reversal. Therefore, traders should not solely rely on the symmetrical triangle pattern but combine it with other technical analysis tools and indicators to increase the probability of successful trades.