Cup and Handle
The Cup and Handle pattern is a popular chart formation that signals a bullish continuation in technical analysis. This pattern typically occurs during an uptrend and suggests a temporary pause in the price movement before resuming the upward momentum. Recognizing the basic characteristics of the Cup and Handle pattern is essential for traders seeking to identify potential trading opportunities.
Basic chart
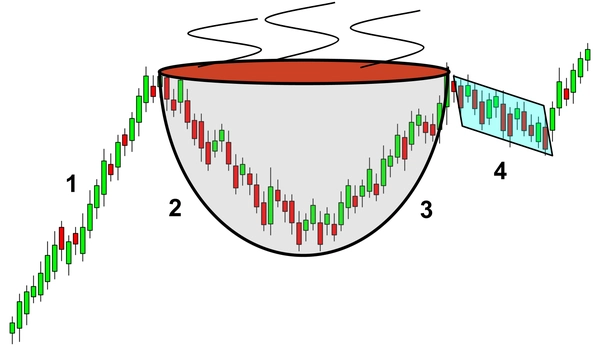
The first four components help shape the structure for the pattern’s name because they form the outline of a cup with a handle.
Cup Formation
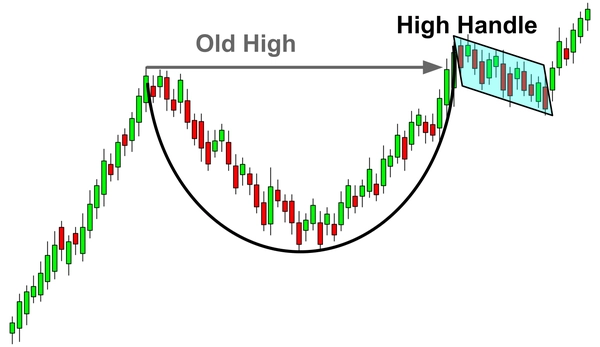
The pattern begins with a rounded bottom, forming a "U" shape resembling a cup. This part represents a period of consolidation where selling pressure subsides, and buyers gradually take control.
Handle Formation
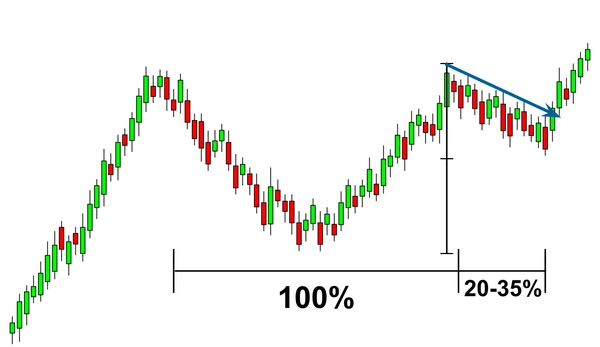
Following the cup formation, there is a small pullback known as the handle. It resembles a short dip in price, forming a smaller consolidation pattern.
Resistance Breakout and Stop Loss
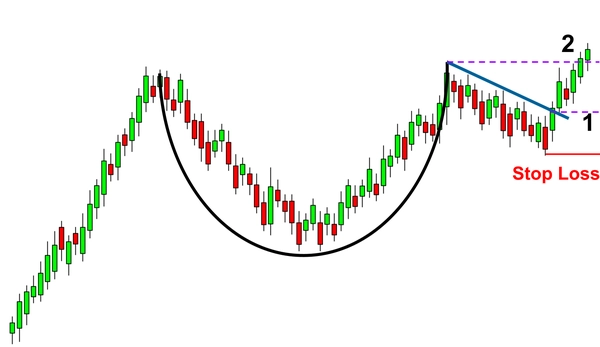
The pattern is confirmed when the price breaks above the resistance level formed by the top of the cup and the handle, indicating a bullish continuation.
Target
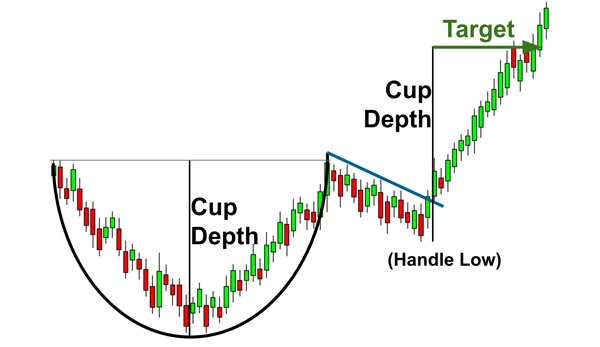
The projected target is often measured by taking the depth of the cup from the bottom to the rim and adding it to the breakout level.