Double Top and Double Bottom
A double top pattern occurs when the price of an asset reaches a significant high, retraces, and then rallies again to approximately the same level as the previous high before experiencing a downward reversal. The pattern resembles the letter "M" on the price chart.
Double Top Basic
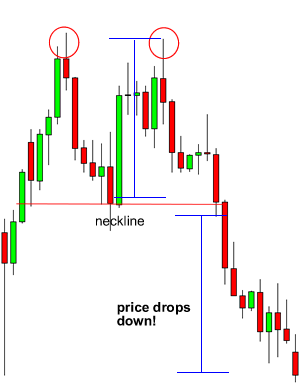
The double top pattern forms after an uptrend and signifies a possible trend reversal. It consists of two consecutive peaks that reach a similar resistance level, creating a distinct "M" shape on the price chart. The pattern suggests that buying pressure is waning and selling pressure may take over.